

Hedera Hashgraph (HBAR) has positioned itself as a high-performance, enterprise-focused blockchain solution that supports applications in tokenization, micropayments, NFTs, and secure data management. As of early February 2026, HBAR is trading near $0.09, reflecting ongoing market consolidation following broader crypto volatility.
We provide a detailed HBAR price analysis covering its price history, technical trends, and expert predictions for 2026 through 2030. You’ll also gain insight into the factors driving HBAR’s value, along with technical indicators to consider when making investment decisions.
Hedera (HBAR) Overview
Hedera (HBAR) is a public distributed ledger that uses the hashgraph consensus to solve blockchain’s scalability and ensure fast, secure transactions. It powers decentralized applications (dApps) with enterprise-grade features, including high throughput, low fees, and robust network security.
Hedera employs hashgraph instead of blockchain, enabling asynchronous Byzantine Fault Tolerance (aBFT) via gossip-about-gossip protocol and virtual voting. This achieves up to 10,000 transactions per second with 3-5 second finality, outperforming Bitcoin’s 7 TPS.
The core Hedera services include Token Service (HTS) for NFTs and tokens, Consensus Service (HCS), and EVM-compatible smart contracts via Hyperledger Besu. Alongside these, the Hedera Hashgraph network has a native token, HBAR.
HBAR has a maximum supply of 50 billion and is used to fuel the network: fees (fixed in USD), staking to secure network nodes, and future governance. It’s proof-of-stake based, with HBAR holders earning rewards. The current price of HBAR is around $0.09- $0.093, with a $3.98B market cap and daily volume of around $18M.
Hedera (HBAR) Price History and Performance
Below is a breakdown of how Hedera’s native token, HBAR, has historically performed, highlighting major market cycles, adoption phases, and price behavior.
- Launch and All-Time Low (2019): HBAR started trading around $0.03–$0.04 after the mainnet launch. It briefly dipped to an all-time low near $0.009.
- 2019 – 2020 Early Adoption Phase: Throughout late 2019 and most of 2020, HBAR traded largely below $0.05, reflecting limited retail exposure and a market still assessing Hedera’s enterprise-focused model.
- 2021 Bull Run: HBAR rallied aggressively during the 2021 bull cycle, climbing from under $0.05 in January to an all-time high of approximately $0.57 in September 2021. The surge was fueled by broader altcoin momentum, increased awareness of Hedera’s governing council, and enterprise use-case narratives.
- 2022 Bear Market: Like most altcoins, HBAR saw a sharp correction during the 2022 crypto downturn, falling from its highs to the $0.04-$0.06 range by year-end as risk appetite collapsed across the market.
- 2023 Recovery: In 2023, HBAR showed signs of stabilization, briefly trading back toward $0.09-$0.10 as network activity improved and the broader market entered a recovery phase.
- 2024–Early 2026: Trading has ranged from $0.05-$0.12, with consistent volume but below previous highs, signaling cautious investor sentiment.
HBAR Current Market
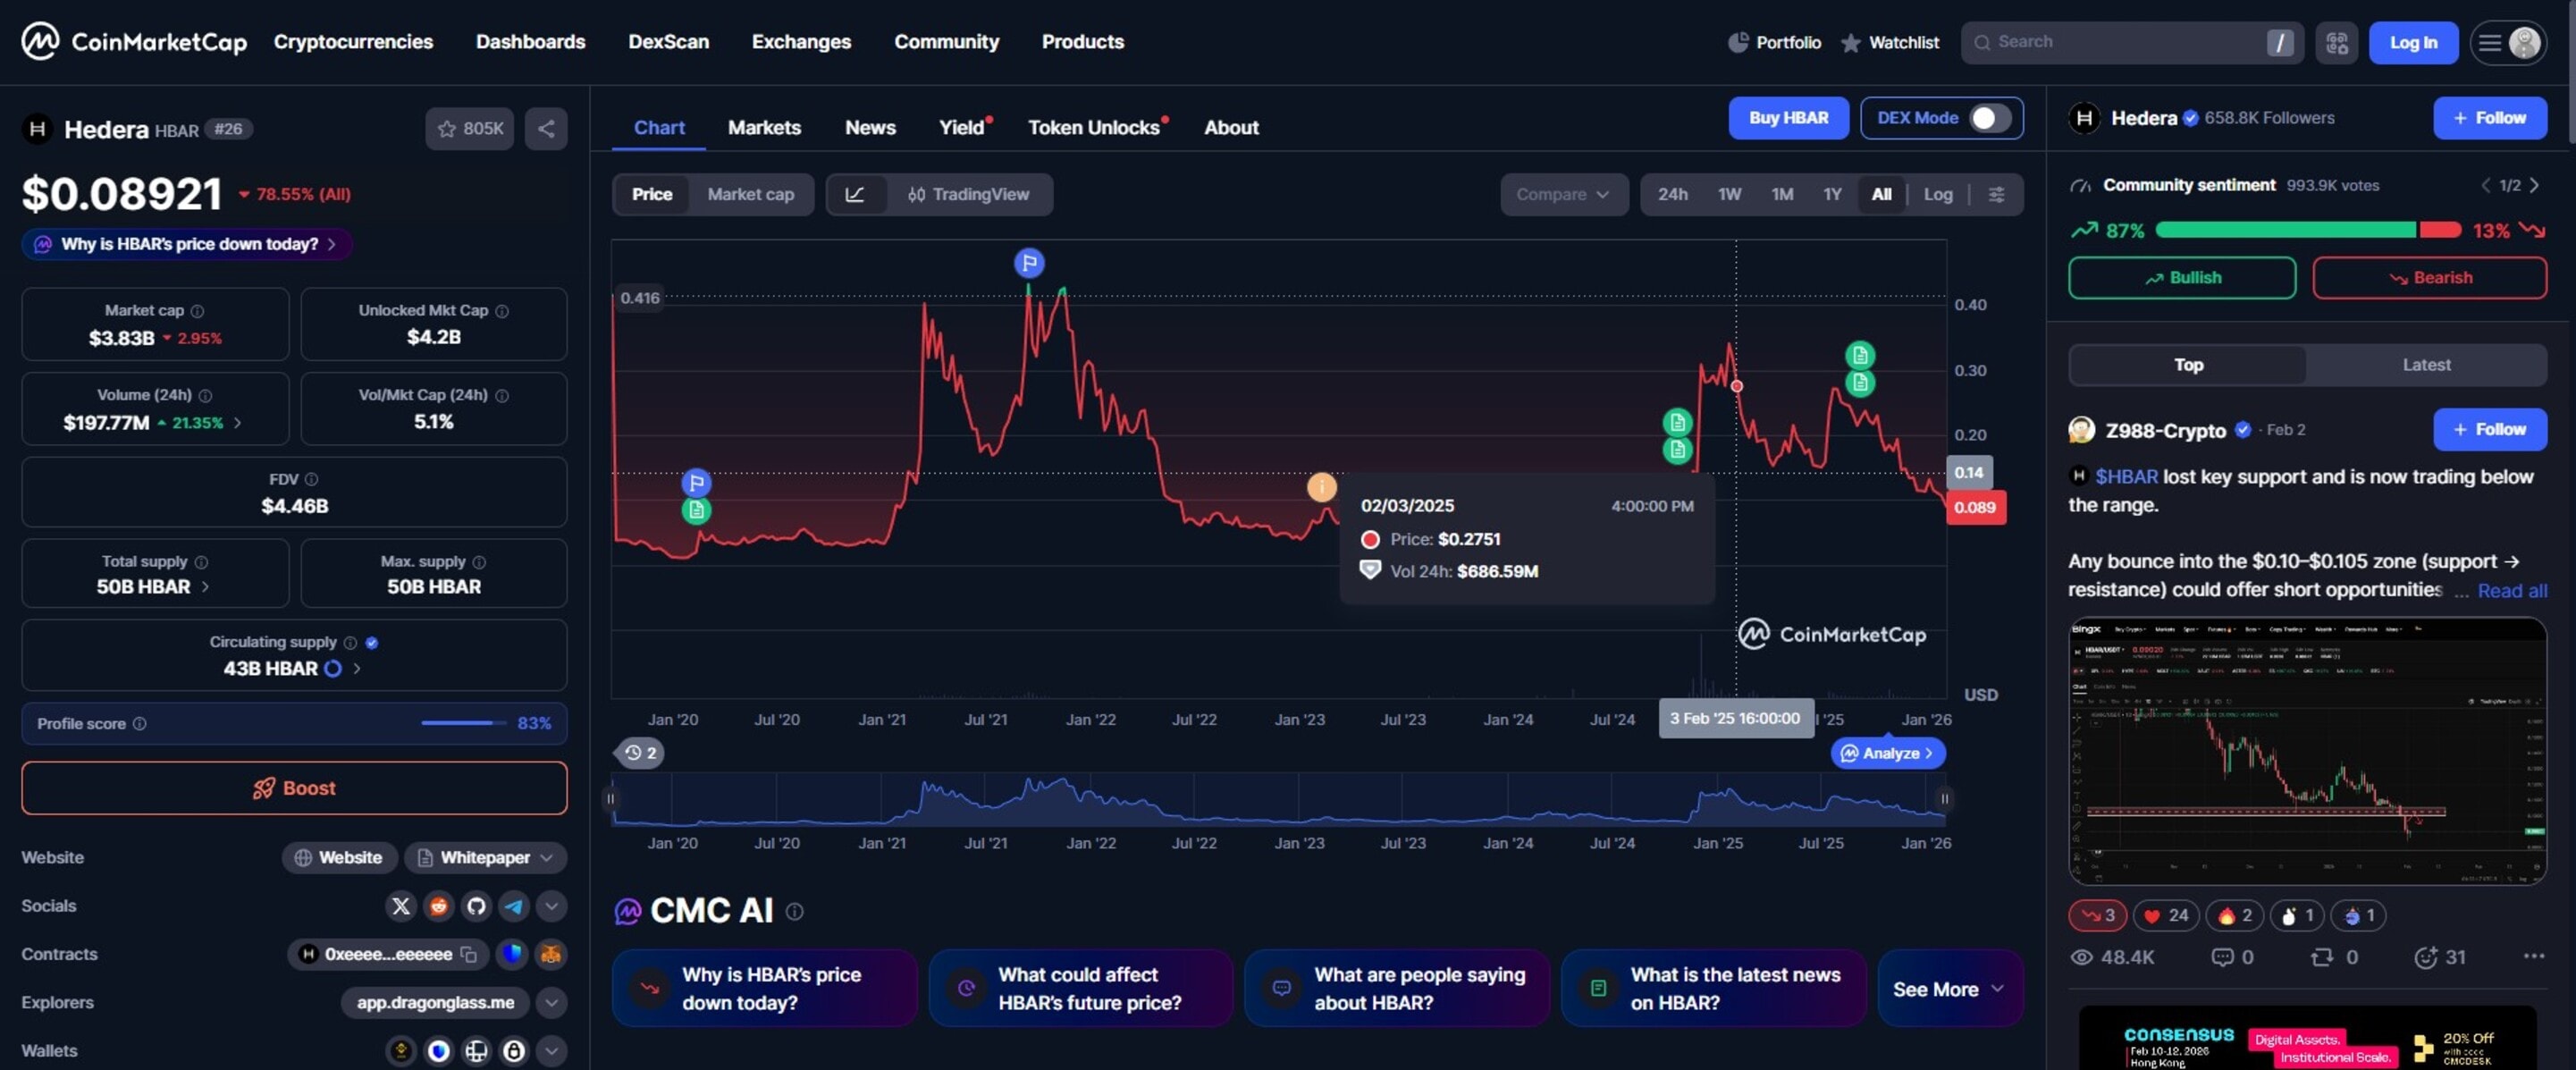
HBAR is trading around $0.09 USD, reflecting ongoing altcoin volatility and broader cryptocurrency market weakness. The token is moving with the general risk-off trend rather than showing unique strength. About 43 billion of the 50 billion max supply is in circulation (86%), giving HBAR a market cap of $3.9 billion. Trading volume remains healthy at $150-$170 million, indicating active liquidity across exchanges.
- Current price: $0.091 USD
- Market cap: $3.9 billion
- Circulating supply: 43 billion HBAR
- Max supply: 50 billion HBAR
- 24-hour volume: $150–$170 million
HBAR remains well above its all-time low, though far below the 2021 high of $0.57. The market shows active trading and institutional interest, but sentiment remains cautious amid macro headwinds.
How Do NFTPlazas Experts Predict HBAR’s Price in the Future?
Rather than relying on short-term hype, our Hedera’s price prediction and analysis focuses on how Hedera Hashgraph’s network usage, token economics, and broader crypto cycles interact over time.
First, we assess real-world adoption and network utility. Hedera’s enterprise-grade distributed ledger technology means HBAR demand is closely tied to transaction volume, enterprise partnerships, and applications built on the network, including tokenization, payments, NFTs, and data integrity use cases.
Next, we examine HBAR’s tokenomics and supply dynamics. With a fixed maximum supply of 50 billion tokens and a large percentage already in circulation, future price appreciation is less about emissions shocks and more about incremental demand growth. This circulating supply profile helps us model dilution risk, long-term valuation ceilings, and realistic upside scenarios.
But fundamentals alone aren’t enough. That’s where historical price behavior and market cycles come in. We analyze how HBAR has performed across previous bull and bear markets, identifying key accumulation zones, resistance zones, and volatility patterns relative to Bitcoin and large-cap altcoins.
Finally, we layer in broader market conditions. Macro liquidity, Bitcoin dominance, and investor risk appetite all influence when capital flows into infrastructure tokens like HBAR. These factors help contextualize timing, drawdowns, upside potential across multi-year horizons, and help us analyze the best altcoins to buy at any point.
HBAR Technical Analysis
HBAR remains under short- to medium-term bearish pressure after failing to reclaim key resistance levels. Rejection near the top of its range pushed it below former support, confirming weak near-term structure.
Breaking the $0.10 level accelerated sell-side momentum, with volume spiking on the drop, suggesting distribution rather than controlled buying. Since then, the price has consolidated on declining volume, signaling indecision: buyers are present, but not yet aggressive.
Key Price Levels
HBAR is trading in a $0.08-$0.10 range, with the critical inflection point near $0.085. Holding above this level supports short-term stabilization, while a break below could expose deeper downside. On the upside, $0.10 – $0.105, previously supported, now acts as resistance and must be reclaimed on strong volume to shift momentum back to buyers.
Support Levels
The key support zones for HBAR are:
- $0.085 – $0.088: Immediate short-term support and the most recent local low. A failure here would weaken the current consolidation structure.
- $0.075 – $0.080: A deeper support range tied to prior accumulation zones, where buyers previously stepped in during extended drawdowns.
- $0.065 – $0.070: A longer-term structural support area that aligns with historical base levels during broader market weakness.
If broader market conditions deteriorate, this lower band could act as a final defensive zone for long-term holders.
Resistance Levels
For HBAR, the most notable resistance zones include:
- $0.10 – $0.105: Immediate resistance following the recent breakdown. This level must be reclaimed to neutralize short-term bearish structure.
- $0.12 – $0.14: A medium-term resistance range where multiple prior rallies stalled, suggesting heavy supply overhead.
- $0.18 – $0.20: A major historical resistance zone tied to previous bull-cycle distribution, likely to attract profit-taking if revisited.
Unless HBAR can break and hold above these resistance levels with expanding volume, price action is likely to remain range-bound or skewed toward further downside tests.
Hedera Hashgraph Price Prediction 2026
| Month | Minimum Price (USD) | Average Price (USD) | Maximum Price (USD) |
| January | $0.082 | $0.094 | $0.108 |
| February | $0.085 | $0.098 | $0.113 |
| March | $0.088 | $0.102 | $0.118 |
| April | $0.091 | $0.106 | $0.123 |
| May | $0.094 | $0.110 | $0.129 |
| June | $0.097 | $0.114 | $0.134 |
| July | $0.100 | $0.118 | $0.140 |
| August | $0.103 | $0.122 | $0.145 |
| September | $0.106 | $0.126 | $0.151 |
| October | $0.109 | $0.130 | $0.157 |
| November | $0.112 | $0.134 | $0.162 |
| December | $0.115 | $0.138 | $0.168 |
Compare HBAR predictions with our in-depth SUI price prediction to determine which token is best suited for your investment strategy.
HBAR Price Prediction 2027
| Month | Minimum Price (USD) | Average Price (USD) | Maximum Price (USD) |
| January | $0.118 | $0.142 | $0.175 |
| February | $0.121 | $0.146 | $0.182 |
| March | $0.124 | $0.150 | $0.189 |
| April | $0.127 | $0.154 | $0.196 |
| May | $0.130 | $0.158 | $0.203 |
| June | $0.133 | $0.162 | $0.210 |
| July | $0.136 | $0.166 | $0.218 |
| August | $0.139 | $0.170 | $0.225 |
| September | $0.142 | $0.174 | $0.232 |
| October | $0.145 | $0.178 | $0.239 |
| November | $0.148 | $0.182 | $0.246 |
| December | $0.151 | $0.186 | $0.253 |
HBAR Price Prediction 2028
| Month | Minimum Price (USD) | Average Price (USD) | Maximum Price (USD) |
| January | $0.155 | $0.190 | $0.265 |
| February | $0.159 | $0.195 | $0.278 |
| March | $0.163 | $0.200 | $0.292 |
| April | $0.167 | $0.205 | $0.305 |
| May | $0.171 | $0.210 | $0.319 |
| June | $0.175 | $0.215 | $0.332 |
| July | $0.179 | $0.220 | $0.346 |
| August | $0.183 | $0.225 | $0.359 |
| September | $0.187 | $0.230 | $0.373 |
| October | $0.191 | $0.235 | $0.386 |
| November | $0.195 | $0.240 | $0.400 |
| December | $0.199 | $0.245 | $0.414 |
HBAR Price Prediction for 2026, 2027, 2028, 2029, and 2030
| Year | Average Price Prediction (USD) |
| 2026 | $0.14 |
| 2027 | $0.19 |
| 2028 | $0.25 |
| 2029 | $0.33 |
| 2030 | $0.42 |
Next Read: Check out our Bonk price prediction for 2026 to 2030 to see how it is performing compared to HBAR.
What Factors Influence HBAR Coin’s Price?
- Network Adoption and Transaction Volume: HBAR’s long-term value is closely tied to actual usage on the Hedera network. Growth in enterprise applications, tokenization, payments, NFTs, and data-integrity use cases directly increases demand for HBAR to cover transaction fees.
- Enterprise Partnerships and Governing Council Activity: Hedera’s governing council model is a core differentiator. Announcements, expansions, or deeper integrations from council members can materially affect investor confidence and long-term valuation expectations.
- Cryptocurrency Market Conditions: Like most altcoins, HBAR is heavily influenced by Bitcoin’s trend, market liquidity, and macro risk sentiment. Strong bull markets tend to amplify upside, while risk-off environments suppress valuations regardless of fundamentals.
- Developer Activity and Ecosystem Growth: An expanding developer ecosystem signals long-term network viability. Increases in tooling, grants, and on-chain applications often precede sustained price appreciation rather than short-lived pumps.
HBAR Short-Term Price Forecast
HBAR is trading around $0.09, under short-term bearish pressure below the 50-day moving average near $0.10. Momentum points to continued consolidation, with limited upside to $0.092-$0.095 if volume remains low. A move above $0.10 would shift the bias bullish, targeting $0.11, while a breakdown below $0.085 could push HBAR toward $0.078 – $0.080, where buyers previously stepped in.
If you’re looking to invest in other crypto price predictions, we’ve compiled a list of the best penny cryptocurrencies to buy right now based on market behaviour and other defining factors.
Final Thoughts
While the HBAR is unlikely to deliver explosive, hype-driven gains, its value proposition rests on slow but consistent growth, steady enterprise adoption, network usage, and broader market cycles. Price appreciation over time will depend less on narratives and more on real demand and capital rotation into infrastructure assets. For investors with a long-term horizon, HBAR remains a fundamentals-first bet rather than a short-term trade.
FAQs
HBAR reaching $1 is possible but unlikely in the near future. At $1, Hedera’s market cap would exceed $50 billion, which would require sustained enterprise adoption, strong crypto market conditions, and a full-scale bull cycle.
HBAR may be a good investment for long-term investors who prioritize fundamentals, real-world usage, and network stability. Its enterprise-focused design makes it more suitable as a good investment long-term infrastructure play rather than a short-term speculative asset.
Hedera uses a hashgraph consensus model instead of a traditional blockchain, enabling faster finality, low fees, and high throughput.
You can buy HBAR on major, well-established cryptocurrency exchanges that support spot trading and offer strong security practices. While you are deciding on an exchange to use, ensure you learn how to buy crypto to avoid losing money.
Based on current adoption trends and realistic market growth assumptions, HBAR’s average price projection for 2030 is around $0.42, with upside potential in a strong bull market and downside risk if adoption or market sentiment weakens.


