

Bitcoin and Ether steadied Sunday as traders weighed a fragile hold above $100,000 for BTC and a rebound in ETH toward the mid-$3,000s amid tentative risk appetite.
Bitcoin and Ether held steady on Sunday as traders balanced on a knife-edge. As per Coingecko data, Bitcoin traded near $102,100, about +2% in 24 hours.
On the other hand, Ethereum hovered around $3,530, about +4% in 24 hours.
The market was shaped by a modest increase in US spot Bitcoin ETF demand late last week, alongside a cautious macroeconomic backdrop that kept crypto prices stuck in a range.
Bitcoin Price Prediction: Can Bitcoin Hold Above $100K After Recent Volatility?
US spot Bitcoin ETFs turned positive again on Thursday, November 7, attracting roughly $240M after six consecutive days of outflows.
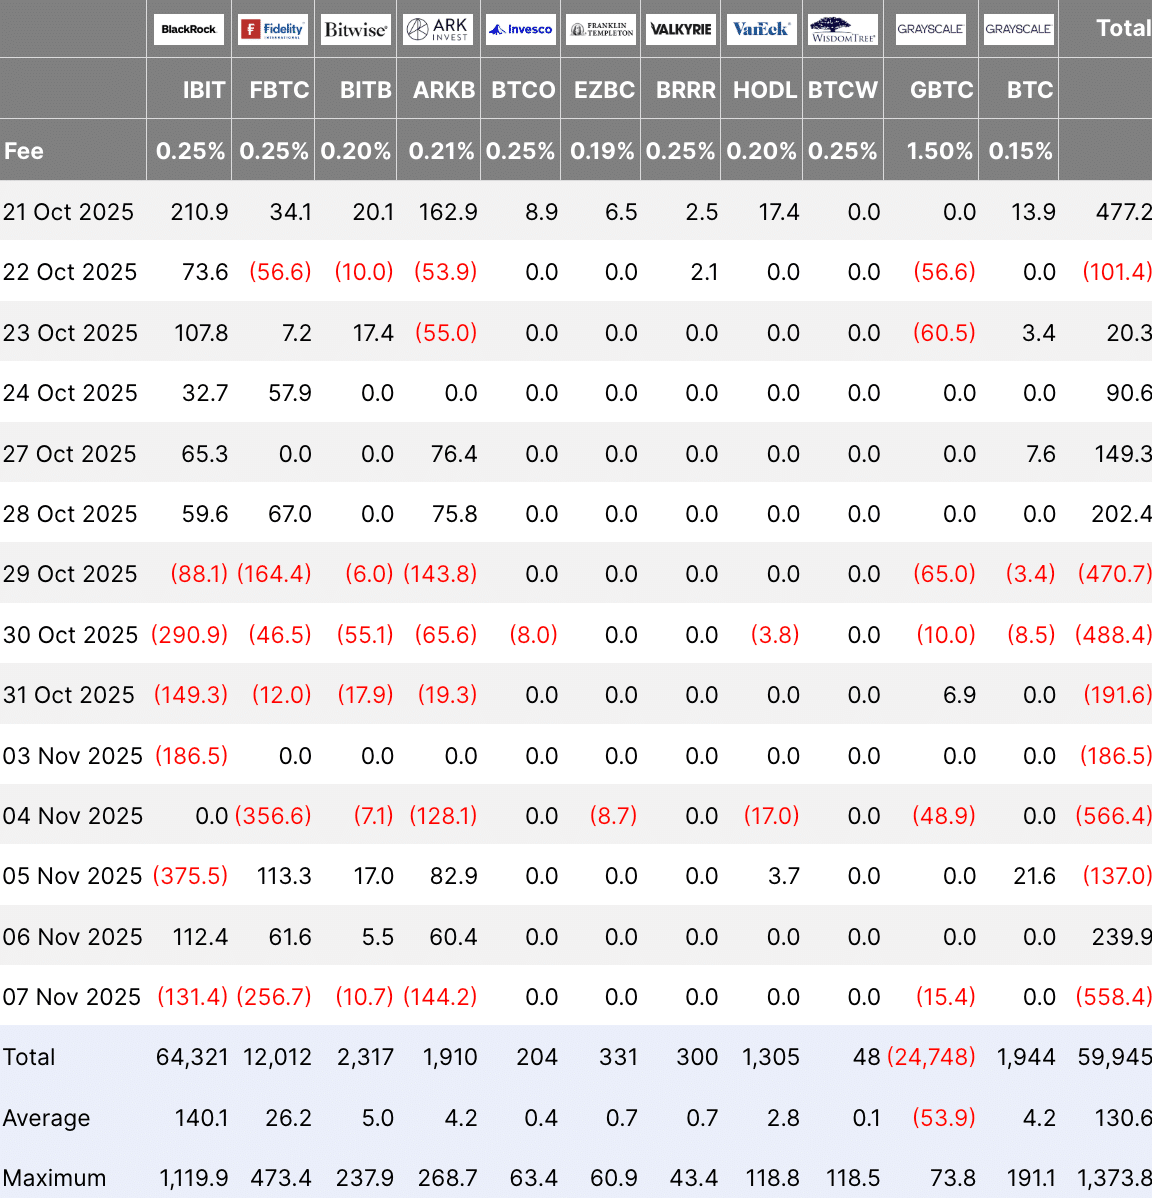
Most of the buying came from products offered by BlackRock, Fidelity, and ARK Invest, according to figures from Farside Investors.
Ethereum developers have set December 3 for the Fusaka upgrade, which will introduce PeerDAS.
The feature is meant to expand data capacity for layer-2 networks. It’s an important step for the ecosystem, even as ETH prices remain choppy.
The swing back to ETF inflows followed a rough start to November and arrived alongside calmer weekend trading. It suggests a more stable mood rather than a clear shift in direction.
Earlier in the week, Bitcoin briefly fell below $100,000. The slip came during a broader pullback across crypto and related stocks, with liquidations and position cuts adding pressure.
Bitcoin’s heat map shows thick liquidity sitting between about $110,000 and $125,000. That suggests many resting sell orders above the current price.
The fuel is ready for the next $BTC rally.
All we need is the US government shutdown to end soon. pic.twitter.com/N6xhLijBoi
— Ash Crypto (@AshCrypto) November 9, 2025
The market has been easing since early October, when Bitcoin briefly traded near $123,000. Since then, it has moved lower, marking a pattern of lower highs and lower lows into early November near $100,000.
Liquidity looks heaviest around $115,000 and $120,000, where the yellow-green bands cluster. Areas below show lighter activity, pointing to fewer buyers.
A sharp slide in mid-October left a thin pocket of support, though liquidity has started to form again.
EXPLORE: Best Solana Meme Coins To Buy
Ethereum Price Prediction: Can ETH Break the Heavy $3,700 Supply Zone?
Ethereum is also approaching a significant supply zone near $3,700. About 869,000 ETH were bought around this level, creating a strong resistance cap.
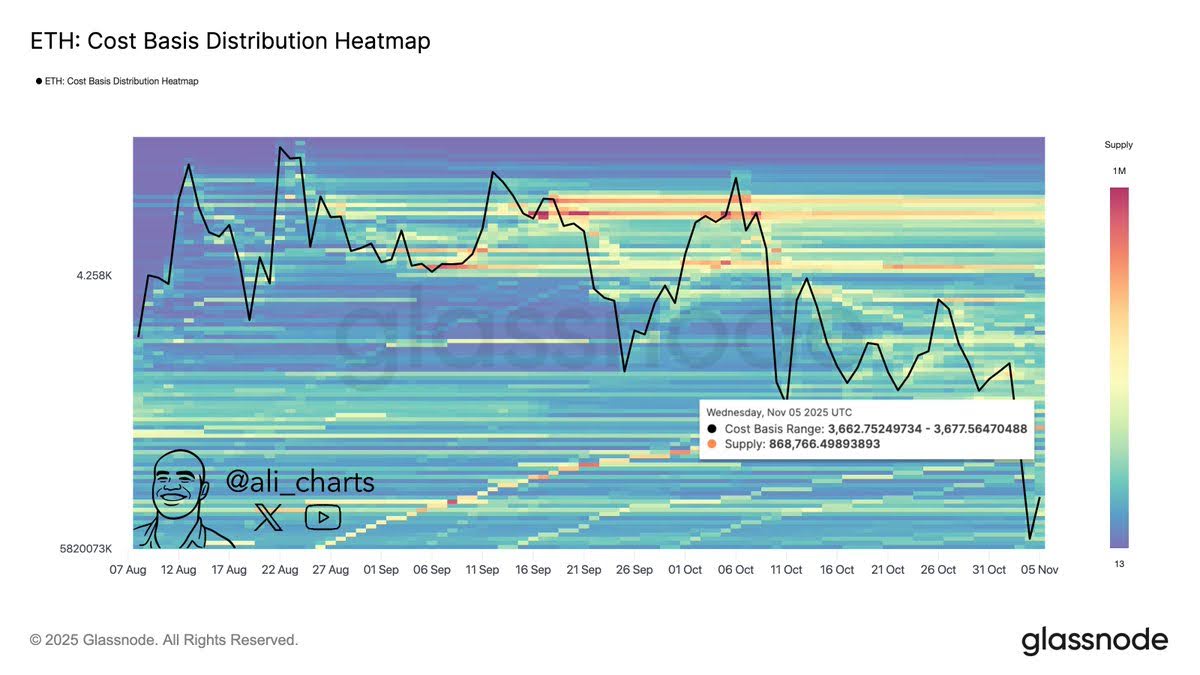
Glassnode’s cost-basis data shows many holders sitting near break-even here, so some may sell if prices bounce.
Recent price action tells a similar story. ETH has tried several times to break above the $3,700–$4,200 band but failed, with each attempt followed by sharp pullbacks.
Ethereum has been making lower highs since mid-October. That shows momentum is slowing. Unless the price can push above this tight resistance area, it may keep moving sideways or slip lower, as sellers still sit overhead.
On the hourly chart, ETH is working its way back after a sharp pullback earlier in the week.
$ETH on the hourly looks like it wants to go vertical.
Next week will be HUGE. pic.twitter.com/Kybrpkr3oR
— Gordon (@AltcoinGordon) November 9, 2025
The price has been making higher lows along a rising trendline, suggesting buyers are stepping in. It recently climbed toward $3,440 after holding support near $3,300.
Momentum looks better in the short term. Price candles are holding above the trendline and trying to clear the recent congestion zone.
There is no firm breakout yet, but the slow grind higher points to growing interest. A clean move above $3,480–$3,500 could open more upside.
If ETH falls back under the trendline, the picture weakens. For now, the market looks like it’s building pressure to the upside.
DISCOVER: 16+ New and Upcoming Binance Listings in 2025
The post Bitcoin and Ethereum Forecast: Can BTC Rebound Toward $115K and Will ETH Clear Its Major Resistance Zone? appeared first on 99Bitcoins.


