

TL;DR
- Ethereum stablecoin liquidity hits $163.5B, with $99.1M revenue showing strong demand for blockspace.
- ETH trades sideways near $4,360, key resistance at $4,500, support zones at $4,200–$3,880.
- The accumulation map shows ETH near the “Steady” zone, historically linked to long-term investor positioning.
Stablecoin Liquidity and Network Revenue
Ethereum’s stablecoin supply has climbed to a record $163.5 billion in September 2025, up from $152 billion in August. The increase marks one of the strongest liquidity inflows to the network this year and supports activity across decentralized finance and trading platforms.
$ETH liquidity and strength building up
Stablecoin supply has climbed to $163.5B → record liquidity flowing into Ethereum
Network revenue over the last 180 days stands at $99.1M → strong fee capture
THE IMPACT ⬇️
More liquidity means higher trading activity, deeper DeFi… pic.twitter.com/4YNhaIr4jN
— Cipher X (@Cipher2X) September 10, 2025
Ethereum also generated $99.1 million in network revenue over the past 180 days. The figure reflects steady demand for blockspace as users continue to pay transaction fees. Analyst Cipher X commented,
“More liquidity means higher trading activity, deeper DeFi markets and stronger price support.”
Meanwhile, Ethereum remains the largest platform for DeFi, the total value locked standing at $90.9 billion. According to DefiLlama, this amount has slightly gone down in the last 24 hours, though overall levels are still close to yearly highs.
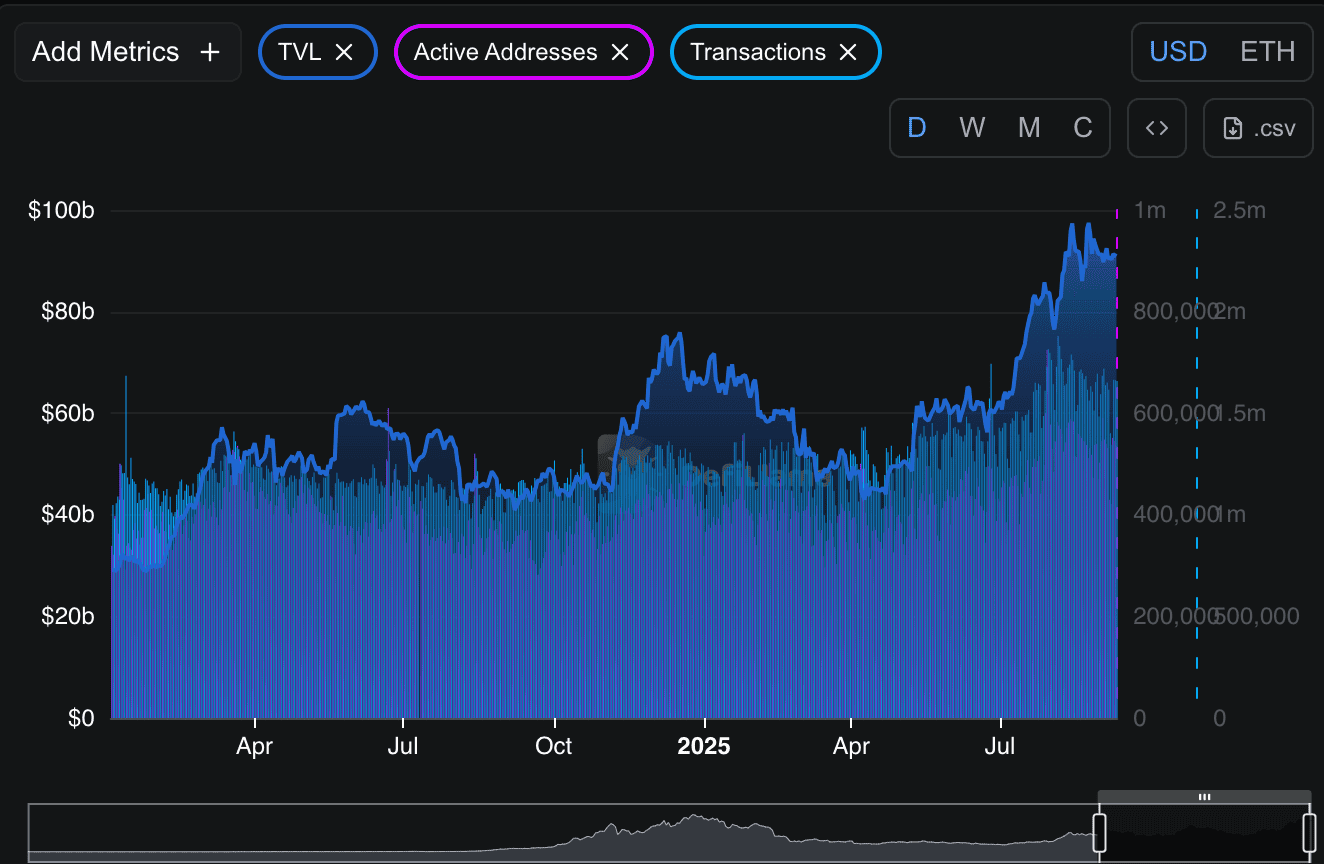
In addition, user movement is active. The network recorded 540,717 active addresses in one day alongside 64,794 new addresses. Daily transactions stood at 1.66 million, indicating a constant demand across applications such as lending, staking, and trading.
Trading Range and Market Outlook
ETH was trading at around $4,360 after nearly two weeks of sideways movement. Resistance sits at $4,500, with a potential move higher targeting $4,883. On the downside, support is seen between $4,200 and $4,100, with deeper levels at $4,060 and $3,880.
Crypto analyst Ted noted,
“Either Ethereum will reclaim $4,500, or a lower flush will happen. Don’t overtrade until there’s a definite direction.”
He also highlighted that Ethereum generated $1.4 million in fees yesterday, the highest among all blockchains.
Long-Term Accumulation Perspective
A fresh monthly MACD crossover has appeared on Ethereum’s chart, which some traders view as a long-term shift after extended consolidation. Merlijn The Trader called it a “monster ignition,” suggesting renewed momentum.
Merlijn also shared an accumulation map, showing ETH near $4,362 in the “Steady” band, just above “Still Cheap.” This area has historically aligned with accumulation phases for long-term holders and larger investors. The upper red zones, labeled “HODL” and “Take Profit,” have coincided in past cycles with retail-driven rallies and profit-taking.
ETHEREUM ACCUMULATION MAP LOADED
Retail panics in blue.
Whales load in green.Right now $ETH sits where legends accumulate.
The red band? That’s where tourists FOMO in and whales dump on them.The map is clear: accumulate when it’s quiet, not when it’s crowded. pic.twitter.com/GrTrKuA5m8
— Merlijn The Trader (@MerlijnTrader) September 9, 2025
With record liquidity, strong user activity, and technical signals aligning, Ethereum is at a point where its next move depends on whether price breaks above $4,500 or falls back toward lower support.
Binance Free $600 (CryptoPotato Exclusive): Use this link to register a new account and receive $600 exclusive welcome offer on Binance (full details).
LIMITED OFFER for CryptoPotato readers at Bybit: Use this link to register and open a $500 FREE position on any coin!


 Network Fee Offer for New Partners")


